![[Return Home]]( http://www.forensic-applications.com/greybutton.jpg) | Forensic Applications Consulting Technologies, Inc. Click here for our Home Pages |
| Forensic Applications Consulting Technologies, Inc. Click here for our Home Pages |
Building consultants often recommend and perform ōclearanceö air sampling after remediation work has been completed in an attempt to demonstrate that the building is safe for occupants. However, NIOSH does not recommend this practice, as there is no scientific basis for the use of air sampling for this purpose.In fact, mould "sampling" and "mould testing" during an assessment for mould at a property is virtually never needed and such "tests" are almost exclusively performed only by consultants who otherwise don't have any legitimate specialized knowledge in moulds. We have provided a discussion on sampling myths and misconceptions here: Sampling Myths.
1) The commonly used method of comparing indoor and outdoor spore concentrations is invalid.
2)It is impossible to determine the indoor airborne spore concentrations using the spore trap methods typically employed.
3)Virtually none of the decisions based on airborne spore concentrations results are valid.
This discussion addresses the problems associated with the rationale and sampling protocols used by the majority of individuals who attempt to perform air monitoring for moulds in buildings. A discussion on the myths of ōclearance samplingö can be found here (ōclearance samplingö is the junk-science ōtestingö practice employed by poorly trained individuals during mould remediation projects.)
Typically, the DQO is not to answer the question: ōAm I exposed to mould?ö (To which the answer is always ōYes,ö) but rather, to answer the question: "Am I exposed to a concentration greater than________?" Where the blank will be filled in by the consultant prior to sampling. And typically, the blank will be: "...the corporate safety policy limit...", or "...a level considered dangerous by my physician..." or ōģthe normal expected concentration for non-symptomatic houses in my areaö or similar. The person collecting the sample should then be able to give the numerical value, up front, that they will be using to justify the DQO and they should be able to give you, very clearly, the rationale behind the justification. (For an example of the DQO process, you can see the DQOs that we prepared for the State of Colorado in ColoradoÆs Assessment Sampling and Analysis Protocol for clandestine methamphetamine labs; open the document and scroll down to Attachment to Appendix A).
Unquestionably, the greatest flaw in the overwhelming vast majority of air monitoring that is performed is a lack of Data Quality Objectives (DQOs). DQOs are a priori conditions and decisions made before the sampling begins. The methods used for the sampling must meet the necessary detection limits, and must be capable of answering the question being posed.
All too often, we encounter those who incorrectly think the reason they are collecting air samples is to answer the question: ōIs there mould in the air?ö Since the answer to that question is always ōYes,ö then why waste the money on the samples?
Air sampling is NOT a part of a typical initial mould investigation. Air sampling for moulds in buildings is virtually never needed on initial investigations. If a consultant begins collecting air samples in your building or home as one of their first activities, that is a good sign that they are spending your money without having clearly defined objectives in their investigation.
Prior to beginning an air sampling scheme, the most important step is properly defining the question that is really being asked and establishing DQOs that will answer the question. The DQOs are essentially the quantified answer to the question. Armed with the DQOs, one can then select the most appropriate sampling and analysis procedure; keeping costs to a minimum, while still achieving the DQOs.
Building Conditions
In general, the building should be in a condition that emulates the normal occupied conditions of the building. There is no point in sampling building conditions that donÆt normally exist when the building is occupied (unless the DQOs address the non-standard building conditions).
For purposes of classifying conditions during microbial sampling, structures are considered to be in one of two modes: ōopen building conditionsö or ōclosed building conditions.ö In ōopen building conditionsö the influx of outdoor air has a significant influence on the indoor air. In ōclosed building conditionsö the building is sufficiently isolated with conditioned air such that the outdoor air does not significantly influence the indoor air. Most commercial buildings operate under closed-building conditions, and most homes are maintained under closed building conditions.
The mode of the sample building must be known prior to sampling and quantified during sampling. Without this very important information, the very best air sampling methods and results may be utterly useless.
Unless all the doors and windows are open and there is a breeze blowing through your building (literally), ask your consultant how they intend to quantify outdoor influences on the indoor air. If they canÆt answer the question, you shouldnÆt let them spend your money.
Indoor versus Outdoor Concentrations
Much of the literature concerning the quantification of indoor airborne fungi recommends that indoor samples should always be accompanied by outdoor samples. These recommendations are based on the lack of consensus standards for airborne fungal counts (i.e., no direct comparison to ōacceptableö levels can be made), and the unfounded (indeed erroneous) premise that indoor spore concentrations should always be lower than outdoor concentrations and the erroneous notion that there is good correlation between strength of outdoor contaminants and indoor concentrations.
For a start, too many broad statements are made without due considerations for regional and microclimate changes that can greatly alter the variations in concentrations, and can greatly alter the relationship between the indoor environment and the outdoor environment.
For example, consider fungal data collected from the Rocky Mountain region at latitudes spanning from about 35 degrees north to 45 degrees north versus samples collected from Bucerias, Mexico, located on the same latitude as the Hawaiian Islands, with its sub-tropical climate. For the most part, populations in the northern climes have significant seasonal changes and their practices of indoor environmental control changes with those seasons. Whereas in Bucerias, many buildings have no windows whatever, and doors are merely gates; the indoor to outdoor relationships are vastly different.
As such, unless one already has defined the indoor to outdoor relationship for a particular location, for a particular time of year under specific weather conditions, under specific building conditions, how can one compare an indoor to an outdoor count?
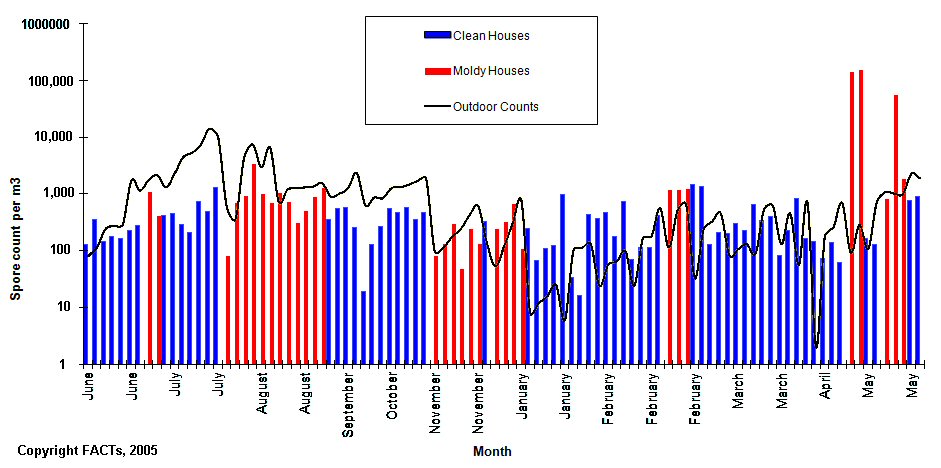
Our data indicate that for samples collected under ōclosed building conditions,ö regardless of the region, there is poor correlation 1 between indoor and outdoor fungal profiles (genera, species and total counts) and regardless of whether the building is a ōproblemö (symptomatic) building or a ōhealthyö (non-symptomatic) building. Studies by other researchers 2 have made similar conclusions regarding outdoor versus indoor influences, particularly with regard to particulates.1a
We will provide data on this issue in a section below, in the meantime, in the graphic below, we have presented data for indoor and outdoor fungal concentrations for both symptomatic (problem) buildings and non-symptomatic (healthy) buildings.

Based on our experience, the two most common methods used while sampling aerobiology, are the Anderson method (for viable organisms) and spore trap methods such as the Air-O-Cell method (for total airborne fungi.)
Fungal Air Sampling Methods
There are no completely accepted protocols for the analysis of biota in air. Different situations will call for different protocols. And different methods will bias certain genera of fungi high or low depending on the particle size of the spores. (Some excellent work on the subject of particle size collection profiles has been performed and reported in searchable peer reviewed literature by Tiina Reponen, PhD, Department of Environmental Health, University of Cincinnati.) Direct comparison of results from one sampling method to those results of another sampling method is not possible. Unless the sampling methods and analysis methods are identical, one cannot directly compare data.
In our opinion, viable counts carry far less weight than do total counts (such as the Air-O-Cell method). For a start, the sampling error associated with aerobiology is already huge but there are additional errors associated with the Anderson collection technique. Therefore, even comparing Anderson results with Anderson results may be difficult and misleading. In any event, since the offending epitope (allergen) will be associated with the spore, regardless of whether that spore is dead or alive, performing viable sampling (samples reported as CFUs ¢colony forming units) will always bias the spore count low, and underestimate exposure.
Distribution of Aerobiology
Regardless of the method selected, total counts of airborne fungi exhibit a spatial and temporal lognormal distribution throughout the day.4 This means that the variation about the mean can be very high and skewed in one direction. A consultant who collects one or two or even three air samples from a building is doing little more than guessing at the average concentration within the building. See the graphic below.

Based on our experience (for the same geographical boundaries) closed-mode indoor fungal counts in buildings whose occupants are experiencing symptoms attributed to fungal problems and/or for buildings which have widespread mould growths in the crawlspace or living areas, the MVUE is 2,280 counts/m3 and fungal concentrations exceed 900 counts/m3 greater than 60% of the time. The fungal concentration for symptomatic buildings we have visited in Colorado have been in excess of 5,000 counts (in California, we have observed fungal fragment concentrations of 1,700,000 counts/m3 in symptomatic buildings).
According to our database, the viable fungi concentrations of non-symptomatic, healthy environments is not dissimilar; 383 colony forming units per cubic meter of air (CFU/m3), with a 95% probability that one sample in five (21%) samples will exceed 900 CFU/m3.
LetÆs revisit the indoor vs. outdoor question again. The outdoor spore concentrations change dramatically with season, and exhibit a bi-modal distribution whose peaks are in the early spring and early autumn. Unfortunately, our definition of season (summer, autumn, etc.) is based upon the equinoxes, but moulds are more interested in mean diurnal temperatures and precipitation levels, and so there is more correlation between mean diurnal temperatures than lunar seasons. Nevertheless, our database indicates that (for the previously mentioned latitudes) the total fungal indoor counts in non-symptomatic closed-buildings is not influenced by the outdoor fungal concentrations.
In the data set provided (latitude and altitude defined) Winter outdoor MVUE fungal counts average about 209 counts/m3, with individual counts exceeding 900 counts/m3 approximately 10% of the time. Spring counts are approximately 900 counts/m3 with individual counts exceeding 900 counts/m3 approximately 40% of the time. The summer counts average about 3,500 counts/m3 with individual counts exceeding 900 counts/m3 approximately 72% of the time. And yet, non-symptomatic indoor counts remain roughly the same throughout the year (horizontal central line).

Not only is there no valid indoor/outdoor relationship (out side the context of specific DQOs), the outdoor variability is similar in context with the indoor variability. Consider the following data which were collected form an actual case:
Air Monitoring Data
| Time | Indoor Spore Count | Outdoor Spore Count |
| 10:00 | 971 | 6 |
| 13:15 | 16 | 112 |
| 15:23 | 33 | 102 |
| 18:06 | 426 | 133 |
(Certified mould inspectors are not actually certified in anything, and usually have virtually no legitimate training or knowledge in mycology, aerobiology or microbiology. The ōcertificationö process is not recognized, and certificates are frequently nothing more than what the inspector has printed off their own computer. As a general rule, ōcertified mold inspectorsö represent the lowest quality inspection and assessment services, and usually lack scientific foundation, in favor of the more lucrative ōtoxicö mould agenda.)
For a discussion of mould and its occurrence in properties complete with many photographs, visit ourōHabitsö page.
1a Preventing Occupational Respiratory Disease from Exposures caused by Dampness in Office Buildings, Schools, and Other Nonindustrial Buildings, DHHS (NIOSH) Publication No. 2013¢102, November 2012
1 Least square fit, R2 = 0.058
1a El-Hougeiri N., El-Fadel M.IAQ Characterization In Urban Areas: Indoor To Outdoor Correlation Proceedings: Indoor Air 2002
2 Cooley J.D.; Wong W.C.; Straus D.C.; Jumper C.A. Correlation between the prevalence of certain fungi and sick building syndrome, Occupational and Environmental Medicine, September 1998, vol. 55, no. 9, pp. 579-584(6)
3 Shelton BG, Kirkland KH, Flanders WD, Morris GK, Profiles of American Fungi in Buildings and Outdoor Environments in the United States Applied and Env. Microbiology April 2000 pp 1743-1753
4 Shapiro-Wilk W test greater than 0.9913
5 Dean TR, Betancourt D, Menetrez M; Identification of Fungal Species by Multiplex PCR Assay Lecture given at the ASTM International Symposium ōMold in the Indoor Environment: Assessment, Health and Physical Effects, and Remediationö University of Colorado, Boulder, Colorado, August, 2004
6 Vesper SJ, Varma M, Wymer LJ, Dearborn DG et al Quantitative Polymerase Chain Reaction Analysis of Fungi in Dust From Homes of Infants Who Developed Idiopathic Pulmonary Hemorrhaging Journal of Occ. Environ. Medicine Vol. 46 No. 6, June 2004, p. 596-601
7 Meklin T, Haugland RA, Reponen T, Varma M, et al, Quantitative PCR Analysis of House Dust Can Reveal Abnormal Mold Conditions J. Environ. Monit., 2004, 6 (7), 615 ¢ 620
8The last time we analyzed the data, our data shows the MVUE to be 394 counts/m3 with a 13% probability of a single random sample exceeding 900 counts/m3. n=245
Visitors to this page generally have an interest in scientific issues. If you are interested in such matters, you may find some of our other discussions interesting.
A discussion concerning myths surrounding duct cleaning, can be found by clicking here.
For a discussion concerning indoor air quality, click here.
For issues surrounding the history and cause of carpal tunnel syndrome click here.
For a discussion concerning indoor radon click here.
For a discussion concerning the myths associated with laboratory fume hood face velocities click here.
For a discussion concerning laboratory fume hood evaluations, click here.
Finally, for a listing of documents associated with the State of Colorado regulations concerning methamphetamine laboratories (meth-labs), click here.
Using the exclusive criteria that indoor counts should be less than outdoor counts, does this house have a mould problem or not? What if four ōcertifiedö mould inspectors were independently hired and visited the house at each of the times listed ¢ what would each conclude?
Wrap-up
Sampling, analysis and interpretation of aerobiology requires considerable knowledge in microbiology, sampling theory and statistical applications; it is not cook-book, black-box stuff and should not be performed by home inspectors (or industrial hygienists) who lack the necessary knowledge to understand the limitations.
All kinds of fungal and Bacteriological biomarker analyses including LPS layer analysis (endotoxins) for the Gram negatives, PBHAs, phospholipid ester-linked fatty acids, mycotoxins, volatile organic compounds (VOCs also known as MVOCs and UMVOCs when derived from fungi) and polymerase chain reaction amplification is used in microbial assessments.
In conclusion, consultants who are attempting to characterize airborne microbials based on just a few samples or ōindoor v. outdoorö comparisons can't reliably produce meaningful results or data. Do-it-yourself mold testing kits, such as the settling plates marketed by Pro-Labs« and sold through Home Depot« and other retail outlets, are entirely and completely incapable of producing any legitimate results under all circumstances and cannot be interpreted by anyone under any known conditions.
References
This page is a "living discussion;" originally created on October 12, 2002, it was most recently revised on January 26, 2012.
To return to our state-of-knowledge mould page, click here.
| Forensic Applications Consulting Technologies, Inc. |
![[185 Bounty Hunter's Lane, Bailey, Colorado Phone 303-903-7494]](http://www.forensic-applications.com/addressjpg.jpg)